
Introduction
Docker and software in general has allowed us to spin up services within seconds as opposed to hours/days a couple of years ago. In a way it’s great but without documentation you quickly lose track of what services are running on which machine. This article aims at providing a low code solution to this problem.
You could of course go with a no code option by self hosting a wiki solution but that requires a lot of organization to make sure the documentation you are writing does not gets mixed with obsolete information. A second disadvantage of a self hosted wiki is that you have large amounts of data that are duplicated accross services i.e.
- the way machines are backed up
- how they are monitored
- how is it accessed
- what are the internal dependencies
- what are the external dependencies
- what is the runtime used
All of the questions above depend on the cluster where a service is running and the underlying product.
A much better solution that would tackle both these problems would be a SQL database running in sync with your monitoring tools. I’m running grafana and prometheus to monitor my infrastructure and could easily spin up a small sqlite database and an nmap script that regularly scans for new IP’s and assigns them a host_id. We would then supply additional tables through SQL statements to create our CMDB. Administrators would simply open a sql client on their machine or their browser and start documenting. This exercize is laying the ground for a proper IT management and perhaps in the future, a certification that would not only help new recruits onboard faster but would also foster trust with our partners.
Configuration grafana
The docker compose file goes as follows:
1
2
3
4
5
6
7
8
9
10
11
12
13
14
15
16
17
18
19
20
21
22
23
24
25
26
27
28
29
30
31
32
33
34
35
36
37
38
39
40
41
42
43
44
45
46
47
48
49
50
root@monitor:$ touch .env
root@monitor:$ nano docker-compose.yml

services:
  prometheus:
    image: docker.io/prom/prometheus:v2.55.1
    container_name: prometheus
    ports:
      - 9090:9090
    command:
      - '--config.file=/etc/prometheus/prometheus.yaml'
      - '--storage.tsdb.path=/prometheus'
      - '--web.console.libraries=/etc/prometheus/console_libraries'
      - '--web.console.templates=/etc/prometheus/consoles'
      - '--storage.tsdb.retention.time=100h'
      - '--web.enable-lifecycle'
    volumes:
      - ./config/prometheus.yaml:/etc/prometheus/prometheus.yaml:ro
      - ./config/alert.rules:/etc/prometheus/alert.rules:ro
      - ./prometheus-data:/prometheus
    restart: unless-stopped
    labels:
      org.label-schema.group: "monitoring"

  grafana:
    image: grafana/grafana:latest
    container_name: grafana
    ports:
      - "3000:3000"
    volumes:
      - ./grafana-data:/var/lib/grafana
      - /var/nmap:/var/lib/grafana/nmap
      - ./grafana/provisioning:/etc/grafana/provisioning
    restart: unless-stopped
    environment:
      - GF_SECURITY_ADMIN_USER=${ADMIN_USER}
      - GF_SECURITY_ADMIN_PASSWORD=${ADMIN_PASSWORD}
      - GF_USERS_ALLOW_SIGN_UP=false
      - GF_USERS_DEFAULT_THEME=light
      - GF_SERVER_DOMAIN=grafana.local
      - GF_SERVER_ROOT_URL=https://grafana.local
      - GF_SMTP_ENABLED=true
      - GF_DATE_FORMATS_DEFAULT_TIMEZONE=Europe/Berlin
      - GF_SMTP_HOST=email.fqdn.com
      - GF_SMTP_USER=${GF_SMTP_USER}
      - GF_SMTP_FROM_ADDRESS=${GF_SMTP_FROM_ADDRESS}
      - GF_SMTP_PASSWORD=${GF_SMTP_PASSWORD}
    labels:
      org.label-schema.group: "monitoring"
1
2
3
4
5
6
7
8
9
10
11
12
13
14
15
16
17
18
19
20
21
22
23
24
25
26
27
28
29
30
31
32
33
34
35
36
37
38
39
40
41
42
root@monitor:$ mkdir config
root@monitor:$ nano ./config/prometheus.yaml

global:
  scrape_interval:     15s # By default, scrape targets every 15 seconds.

rule_files:
  - "alert.rules"

scrape_configs:

  - job_name: 'prometheus'
    scrape_interval: 5s
    static_configs:
      - targets: ['172.18.0.1:9090']

  - job_name: 'node_exporter'
    static_configs:
      - targets: ['node_exporter:9100','p8-prod01:9100','p8-prod02:9100', 'hz-mailcow:9100', 'hz-ecom:9100']

  - job_name: 'windows_exporter'
    static_configs:
      - targets: ['p9-winclient:9182','p9-addom22:9182']

  - job_name: 'cadvisor'
    static_configs:
      - targets: ['p8-prod01:9101', 'p8-prod02:9101', 'hz-mailcow:9101', 'p8-db:9101', 'p8-proxy:9101', 'hz-ecom:9101']

  - job_name: otel-coredns
    static_configs:
      - targets: ['p8-dns1:9153','p8-dns2:9153','p8-dns3:9153']

  - job_name: 'uptime'
    scrape_interval: 30s
    scheme: https
    metrics_path: '/metrics'
    static_configs:
      - targets: ['uptimekuma.example1.com','uptimekuma.example2.com']
    basic_auth: # Only needed if authentication is enabled (default)
      username: admin
      password: superlongcomplexpassword
1
2
3
4
5
6
7
8
9
10
11
12
13
14
15
16
17
18
19
20
21
22
23
24
25
26
27
28
29
30
31
32
33
34
35
36
37
38
39
40
41
root@monitor:$ nano ./config/alert.rules

- name: targets
  rules:
  - alert: monitor_service_down
    expr: up == 0
    for: 30s
    labels:
      severity: critical
    annotations:
      summary: "Monitor service non-operational"
      description: "Service {{ $labels.instance }} is down."

- name: host
  rules:
  - alert: high_cpu_load
    expr: avg by (instance,mode) (irate(node_cpu_seconds_total{mode!='idle'}[1m])) > 0.8
    for: 30s
    labels:
      severity: warning
    annotations:
      summary: "Server under high load > 80%"
      description: "Host is under high load, the avg load 1m is at {{ $value}}. Reported by instance {{ $labels.instance }} of job {{ $labels.job }}."

  - alert: high_ram_usage
    expr: ((node_memory_MemTotal_bytes) - (node_memory_MemFree_bytes + node_memory_Buffers_bytes + node_memory_Cached_bytes)) / (node_memory_MemTotal_bytes) * 100 > 80
    for: 30s
    labels:
      severity: warning
    annotations:
      summary: "Available server RAM < 20%"
      description: "Host RAM usage is {{ humanize $value}}%. Reported by instance {{ $labels.instance }} of job {{ $labels.job }}."

  - alert: high_storage_usage
    expr: 100 - ((node_filesystem_avail_bytes{job="node_exporter",mountpoint="/",fstype!="rootfs"} * 100) / node_filesystem_size_bytes{job="node_exporter",mountpoint="/",fstype!="rootfs"})>>
    for: 30s
    labels:
      severity: warning
    annotations:
      summary: "Server storage is almost full <20% left"
      description: "Host storage usage is {{ humanize $value}}%. Reported by instance {{ $labels.instance }} of job {{ $labels.job }}."
The configuration above scrapes within regular intervals windows servers, windows clients, dns servers, uptime kuma instances, cadvisor endpoints for LXC containers and anything docker, node_exporter for any virtual machine related metrics and statuses. The alert.rules file is just a small excerpt of what can be monitored with prometheus. As I’m centralizing all of the alerting functions on grafana there are plenty more additional rules and SNMP traps that I’ve configured to make my network resilient through changes and do some regression testing.
As a side note I have a working configuration to integrate SNMP targets like Synology servers into an prometheus that then gets fed into grafana for monitoring and alerting or a syslog proxy that is able to read pfsense logs in real time but I thought it would be too much for one article so I decided to ommit it here.
Setting up nmap and grafana
nmap is handy tool that allows us to add scripts to enrich our outputs.
1
root@monitor:$ nmap -sV -F --script=http-title,ssl-cert -oA myoutput 192.168.1.0/24 10.10.111.0/24
This command looks at the top 100 ports within a couple of subnets. The ouput is then sent to an xml file called myoutput.
Xml unfortunately can’t be imported into grafana as is but if you use this python script you can transform it into a sqlite database. Once that is done simply add a bind mount to make sure
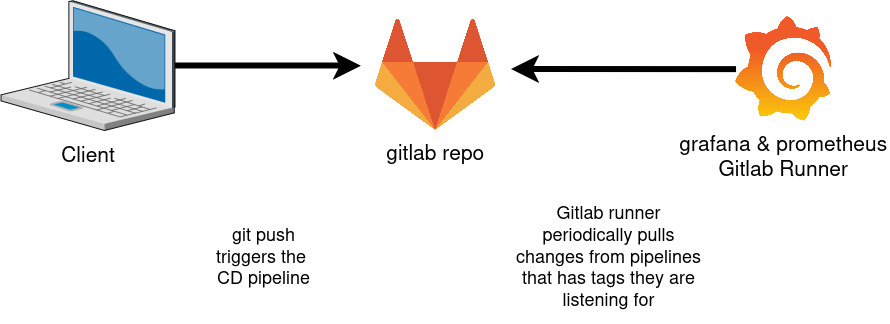
Configuring gitlab
The gitlab configuration is quite straightforward. Start by adding a machine as a Runner by downloading some sources:
1
2
3
root@monitor:$ curl -L "https://packages.gitlab.com/install/repositories/runner/gitlab-runner/script.deb.sh" | bash
root@monitor:$ apt install gitlab-runner
On gitlab go to your project’s page and then > Settings > CI/CD > New runner and follow the wizard. At some point you will be redirected to a summary page where you’re asked to register the runner. Once that’s done you will see whether it was properly added or not at the bottom of the summary page
1
2
root@monitor:$ gitlab-runner register  --url https://git.example.com  --token <TOKEN>
Now the only thing missing is a gitlab pipeline. This one worked for me
1
2
3
4
5
6
7
8
9
10
11
12
13
14
15
16
17
18
19
20
21
root@monitor:$ nano .gitlab-ci.yml

stages:
  - checkout

checkout_job:
  stage: checkout
  script:
    - echo "Cloning into a /var/nmap/webmap..."
    - rm -rf /var/nmap/webmap
    - mkdir -p /var/nmap/webmap
    - git clone "$CI_REPOSITORY_URL" /var/nmap/webmap
    - cd /var/nmap/webmap
    - chmod +x update.sh
    - ./update.sh
    - cd /var/nmap
    - cp nmap_results.db temp.db
    - cat webmap/rebase.sql | sqlite3 temp.db
    - mv temp.db nmap_results.db
  tags:
    - my-tag
As a side note, the script above failed on me at first because grafana can’t read a file owned by “gitlab-runner”. The quick and dirty solution would have been to give the runner sudo privileges (don’t do it). Another easy quick fix is to create an access control list on the directory where the gitlab runner outputs the file nmap_results.db.
1
2
root@monitor:$ cd /var
root@monitor:$ setfacl -d -m u:grafana:rwX nmap
This command modifies (-m) the nmap directory (-d) so that the grafana user will always have read write execute permissions
Coding up your business logic with SQL
1
2
3
4
5
6
7
8
9
10
11
12
13
14
15
16
17
18
19
20
21
22
23
24
25
26
27
28
29
30
31
32
33
34
35
36
37
38
39
40
41
42
43
44
45
46
47
root@monitor:$ nano schema.sql

CREATE TABLE teams
                 (team_id INTEGER PRIMARY KEY AUTOINCREMENT,
                 team_name TEXT
                 );

CREATE TABLE users
                 (user_id INTEGER PRIMARY KEY AUTOINCREMENT,
                 user_name TEXT,
                 team_id INTEGER,
                 FOREIGN KEY (team_id) REFERENCES teams (team_id)
                 );

CREATE TABLE services
                 (service_id INTEGER PRIMARY KEY AUTOINCREMENT,
                 host_id INTEGER,
                 service_name TEXT,
                 service_description TEXT,
                 where_is_it TEXT,
                 architecture_overview TEXT,
                 architecture_dependencies_ext TEXT,
                 architecture_dependencies_int TEXT,
                 how_monitored TEXT,
                 how_backed_up TEXT,
                 FOREIGN KEY (host_id) REFERENCES hosts (id)
                 );

CREATE TABLE products
                 (id INTEGER PRIMARY KEY AUTOINCREMENT,
                 name TEXT,
                 dependencies_int TEXT,
                 dependencies_ext TEXT,
                 server_OS TEXT,
                 runtime TEXT
                 );

CREATE TABLE service_instance
                 (id INTEGER PRIMARY KEY AUTOINCREMENT,
                 service_id INTEGER,
                 product_id INTEGER,
                 name TEXT,
                 service_description TEXT,
                 FOREIGN KEY (service_id) REFERENCES services (service_id)
                 FOREIGN KEY (product_id) REFERENCES products (id)
                 );
This structure made sense for my use case but you might not have it structured the same way where you work so feel free to tweak the business logic. Notice I’m taking full advantage of the built in power of the relational power of SQL to avoid duplication or operational errors like mistyping a service_id. Typos can always arise of course but let’s say you mistype the service_id while adding a new service_instance and if that ID does not exist the database will refuse your commit.
The resulting table can then be queried on grafana and the dashboard would look like this:
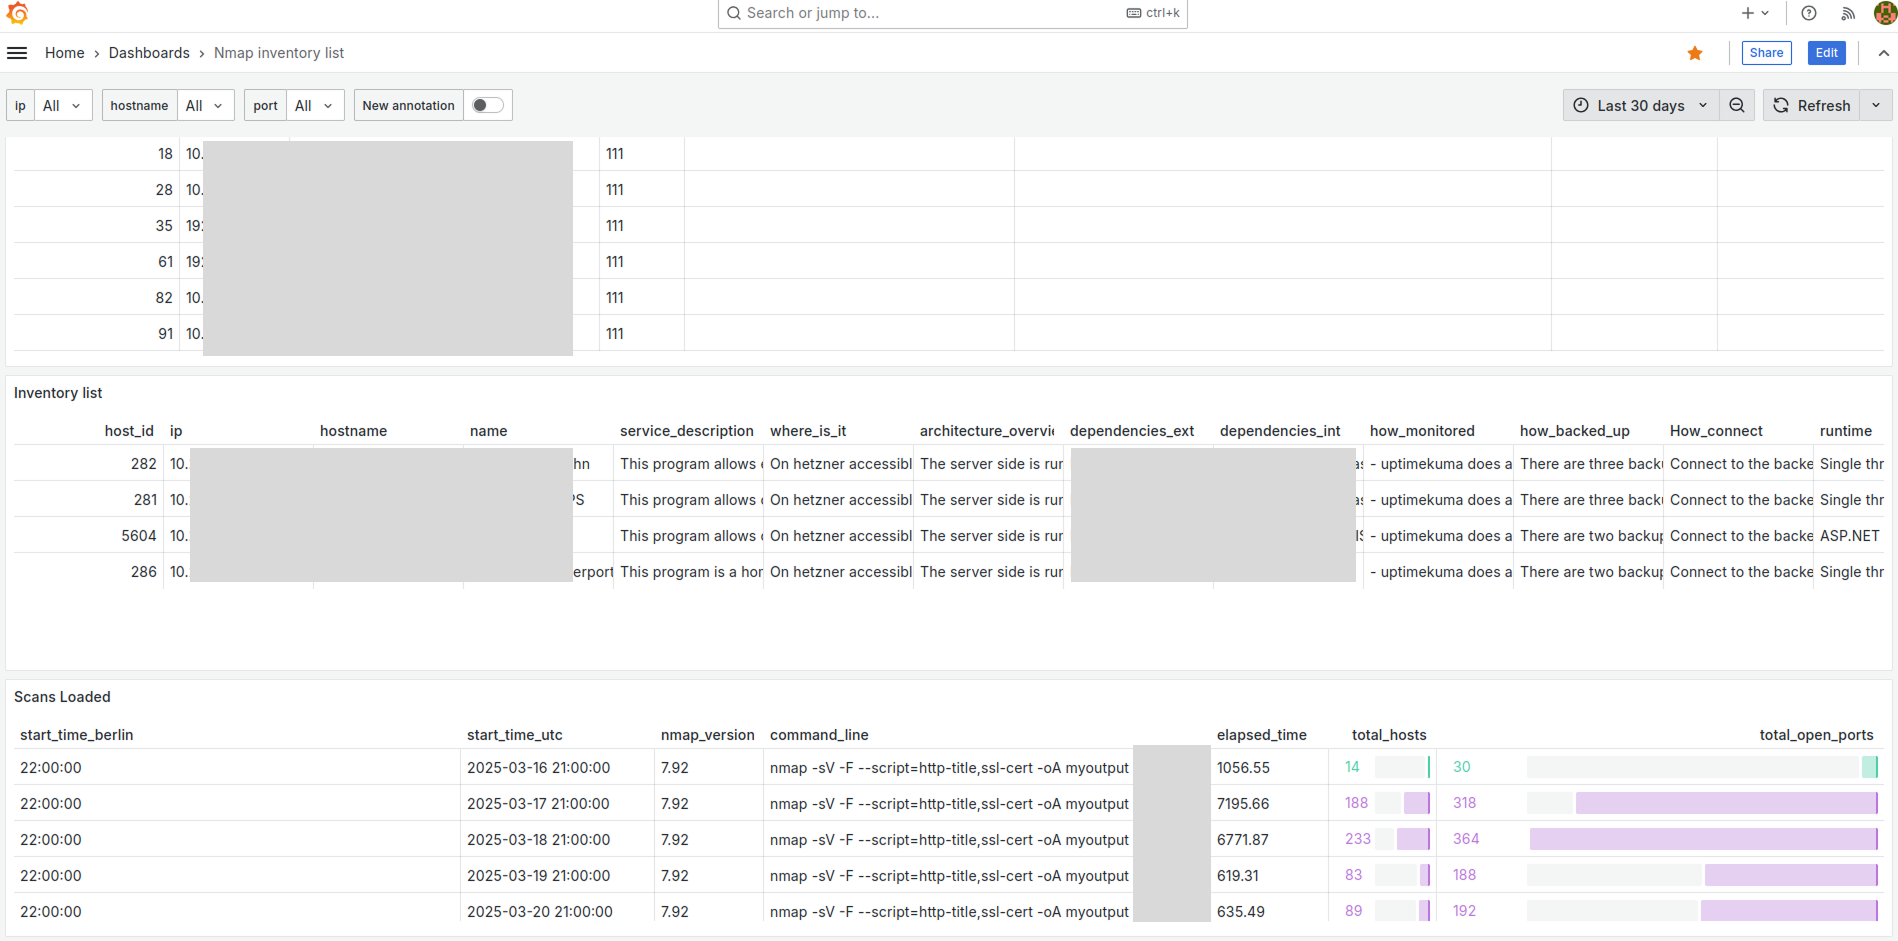
The SQL query to render the inventory list is the following:
1
2
3
4
5
6
7
8
9
10
11
12
13
14
15
16
17
18
19
20
21
22
23
24
25
26
27
28
29
30
31
32
33
34
35
36
root@monitor:$ nano inventory-query.sql

SELECT  i.host_id, h.ip, h.hostname, i.name, i.service_description, s.where_is_it, s.architecture_overview, p.dependencies_ext, p.dependencies_int, i.how_monitored, i.how_backed_up, p.how_connect, p.runtime, intermediary_table1.names as "First Level support", intermediary_table2.names as "Second Level support", intermediary_table3.names as "Third Level support"
FROM service_instance i
LEFT JOIN services s ON s.service_id = i.service_id
LEFT JOIN hosts h ON h.id = i.host_id
LEFT JOIN products p ON p.id = i.product_id
LEFT JOIN service_assignments a ON a.service_instance_id = i.id
LEFT JOIN teams t1 ON a.team_1 = t1.team_id
LEFT JOIN teams t2 ON a.team_2 = t2.team_id
LEFT JOIN teams t3 ON a.team_3 = t3.team_id
LEFT JOIN (
  SELECT
      team_id, GROUP_CONCAT(user_name) as names
  FROM
      users
  GROUP BY team_id
) intermediary_table1 ON intermediary_table1.team_id=t1.team_id
LEFT JOIN (
  SELECT
      team_id, GROUP_CONCAT(user_name) as names
  FROM
      users
  GROUP BY team_id
) intermediary_table2 ON intermediary_table2.team_id=t2.team_id
LEFT JOIN (
  SELECT
      team_id, GROUP_CONCAT(user_name) as names
  FROM
      users
  GROUP BY team_id
) intermediary_table3 ON intermediary_table3.team_id=t3.team_id
WHERE
h.hostname LIKE ("$hostname")
AND h.ip LIKE ("$ip")
That’s it for today. Thanks for sticking around