
Introduction
I’d been testing ways to persist data in kubernetes and considered the mariadb’s galera cluster, zfs, long horn, btrfs and all of these would most likely work for my purposes but they were all lacking in one point or another. The galera cluster didn’t seem optimized for write intensive applications and required a lot of helpers and (external?) proxies to keep in sync. Synchronizing data accross nodes with snapshots did not seem like a solution that I could easily document and trust it to just anyone so btrfs and zfs were out due to complexity. Long horn seemed like a solid option as well but I did not want to choose a solution that would limit ourselves to only block storage and that is tightly coupled to the kubernetes lifecycle.
Ceph on the other hand seemed to tick all the boxes, it works out of the box, it’s future proof, decoupled from the kubernetes eco-system and life cycle, and I wouldn’t have to make sure the changes are synced before moving pods around. Looking back I think it was the right choice and I wouldn’t say the setup was hard, quite the opposite.
In this article I’ll build on top of the 3 node k8s on hetzner’s bare metal machines and add ceph to the 6 available partitions we setup on the cloud machines for that purpose.
Setting up ceph on kubernetes
Overview
Ceph, or should I say “rook Ceph”? Has a series of compulsory and optional services. These are the three compulsory ones:
- ceph-mon: stands for monitor: It keeps the cluster map and state (who’s in the cluster and which OSDs exist) + ensures consensus via quorum. This service communicates on TCP 6789
- ceph-OSD: stands for Object Storage Daemon: It handles actual data storage. Each OSD maps to a disk and stores objects, replicates data, recovers peers, and reports to the ceph-mon’s. Between OSDs this service communicates over TCP ports 6800-7300.
- ceph-MGR/HTTP: stands for Manager: Collects runtime metrics, provides a dashboard, a prometheus endpoint, and runs management modules. It is available at TCP 9283
The firewall
The following ports should be open on the vlan private network:
1
2
3
4
firewall-cmd --zone=myprivate --add-port=6789/tcp --permanent
firewall-cmd --zone=myprivate --add-port=6800-7300/tcp --permanent
firewall-cmd --zone=myprivate --add-port=9283/tcp --permanent
firewall-cmd --reload
The installation
Even though this is not the target as I want to set this up with systemd let’s try installing it on k8s first
1
2
3
4
git clone --single-branch --branch v1.15.3 https://github.com/rook/rook.git
cd rook/deploy/examples
kubectl create namespace rook-ceph
kubectl apply -f crds.yaml -f common.yaml -f operator.yaml
copy over the existing template and edit it
1
2
3
4
5
6
7
8
9
10
11
12
13
14
15
16
17
18
19
20
cp cluster.yaml ceph-cluster.yml
nano ceph-cluster.yml
(...)
  storage: # cluster level storage configuration and selection
    useAllNodes: false
    useAllDevices: false
    nodes:
    - name: "kube-node1"
      devices:
        - name: "/dev/nvme0n1p3"
        - name: "/dev/nvme1n1p3"
    - name: "kube-node2"
      devices:
        - name: "/dev/nvme0n1p3"
        - name: "/dev/nvme1n1p3"
    - name: "kube-node3"
      devices:
        - name: "/dev/nvme0n1p3"
        - name: "/dev/nvme1n1p3"
(...)
Make sure the partition has no formatting by running
1
2
blkid /dev/nvme1n1p3
fdisk /dev/nvme1n1
If it does you can remove it
1
2
umount /dev/nvme1n1p3 || true
wipefs -a /dev/nvme1n1p3
And start the formatting and ceph bootstrap:
1
2
kubectl apply -f ceph-cluster.yml
kubectl apply -f csi/rbd/storageclass.yaml
This should progress as follows:

Deploy the toolbox to be able to query the ceph state
1
2
3
4
5
6
7
8
kubectl apply -f https://raw.githubusercontent.com/rook/rook/master/deploy/examples/toolbox.yaml -n rook-ceph
kubectl get pods -n rook-ceph -l app=rook-ceph-tools

kubectl -n rook-ceph exec -it deploy/rook-ceph-tools -- bash
ceph status
ceph health detail
ceph osd tree
ceph df
If the setup fails you can restart the job by running these lines:
1
2
3
kubectl -n rook-ceph delete job -l app=rook-ceph-osd-prepare
kubectl -n rook-ceph delete pod -l app=rook-ceph-operator
kubectl -n rook-ceph logs -l app=rook-ceph-osd-prepare
Once the cluster is showing up as healthy you can create the PVC and apply it to the database:
1
2
3
4
5
6
7
8
9
10
11
12
13
14
15
16
cat <<EOF > test-pvc.yaml
apiVersion: v1
kind: PersistentVolumeClaim
metadata:
  name: test-pvc
  namespace: cert-manager
spec:
  storageClassName: rook-ceph-block
  accessModes:
    - ReadWriteOnce
  resources:
    requests:
      storage: 1Gi
EOF
kubectl apply -f test-pvc.yaml
kubectl get pvc
And apply the persistent volume to the mariadb deployment like we did on a previous article.
1
2
3
4
5
6
7
8
9
10
11
12
13
14
15
16
17
18
19
20
21
(...)
spec:
  replicas: 1
  selector:
    matchLabels:
      app: mongo
  template:
    metadata:
      labels:
        app: mongo
    spec:
      containers:
      - name: mongo
        (...)
        volumeMounts:
        - name: mongodb-storage
          mountPath: /data/db
      volumes:
      - name: mongodb-storage
        persistentVolumeClaim:
          claimName: test-pvc
You can verify persistence by deleting all database pods or by deleting the deployment and recreating it
1
2
3
kubectl delete pods -l app=mongo -n cert-manager
kubectl delete deployment/mongodb-deployment
kubectl apply -f https://raw.githubusercontent.com/hupratt/kubernetes-the-hard-way/refs/heads/part5/kubeconfiguration/1-mongo-database.yml
Uninstalling
If the setup fails you can tear down ceph by running these lines on all nodes:
1
2
3
4
5
6
7
dnf install -y ceph-volume
wipefs -a /dev/nvme1n1p3
ceph-volume lvm zap /dev/nvme1n1p3 --destroy
wipefs -a /dev/nvme0n1p3
ceph-volume lvm zap /dev/nvme0n1p3 --destroy
# very important if you don't do this you won't be able to recreate a rook cluster
rm -rf /var/lib/rook
Now let’s tear down the cluster. This won’t delete the ceph pools created during the install so if you’re interested in doing that look into the next section: “removing OSDs”
1
2
3
4
kubectl get cephcluster -n rook-ceph
kubectl -n rook-ceph patch cephcluster rook-ceph -p '{"metadata":{"finalizers":[]}}' --type=merge
kubectl -n rook-ceph delete cephcluster rook-ceph
kubectl get cephcluster -n rook-ceph
If you want to rebuild a new ceph cluster you’ll want to recreate the partitions though:
1
2
3
4
5
6
7
8
DISK=/dev/nvme0n1
DISK_SIZE_BYTES=512110190592
DISK_SIZE_GB=$((DISK_SIZE_BYTES / 1024 / 1024 / 1024))
START_GB=$((DISK_SIZE_GB - 50))
parted "$DISK" --script mkpart primary 522MiB ${START_GB}GiB

DISK=/dev/nvme1n1
parted "$DISK" --script mkpart primary 522MiB ${START_GB}GiB
The only way to clear all ceph configuration is to delete the namespace itself:
1
2
3
4
5
6
7
8
9
10
11
12
13
14
15
16
17
18
19
20
21
22
23
24
25
26
27
28
29
30
31
32
33
34
35
36
37
38
39
40
kubectl delete all --all -n rook-ceph
kubectl delete pvc,configmap,secret --all -n rook-ceph
kubectl get namespace rook-ceph -o json | jq '.spec.finalizers=[]' | kubectl replace --raw "/api/v1/namespaces/rook-ceph/finalize" -f -

lsblk
dnf install -y sgdisk
sgdisk --zap-all /dev/nvme0n1p3
dd if=/dev/zero of=/dev/nvme0n1p3 bs=1M count=100 oflag=direct,dsync
blkdiscard /dev/nvme0n1p3
partprobe /dev/nvme0n1p3


kubectl get pvc -A | grep rook
kubectl get configmap -A | grep rook
kubectl get secret -A | grep rook

kubectl delete configmap kube-root-ca.crt rook-ceph-mon-endpoints -n rook-ceph

kubectl delete crd \
cephblockpools.ceph.rook.io \
cephblockpoolradosnamespaces.ceph.rook.io \
cephbucketnotifications.ceph.rook.io \
cephbuckettopics.ceph.rook.io \
cephclients.ceph.rook.io \
cephclusters.ceph.rook.io \
cephcosidrivers.ceph.rook.io \
cephfilesystemmirrors.ceph.rook.io \
cephfilesystems.ceph.rook.io \
cephfilesystemsubvolumegroups.ceph.rook.io \
cephnfses.ceph.rook.io \
cephobjectrealms.ceph.rook.io \
cephobjectstores.ceph.rook.io \
cephobjectstoreusers.ceph.rook.io \
cephobjectzonegroups.ceph.rook.io \
cephobjectzones.ceph.rook.io \
cephrbdmirrors.ceph.rook.io


kubectl get all -A | grep rook
kubectl get crd | grep ceph
Removing OSDs
OSDs are the ceph partitions that hold our data. To remove them here’s the process:
1
2
3
4
5
6
7
8
9
10
11
12
13
14
15
16
17
18
19
20
21
22
23
24
25
26
27
28
29
30
31
32
33
34
kubectl scale deployment rook-ceph-operator -n rook-ceph --replicas=0

# log into the existing toolbox deployment
kubectl -n rook-ceph exec -it deploy/rook-ceph-tools -- bash

ceph pg stat
ceph osd status
ceph osd df tree
ceph osd tree

# to remove existing osds
ceph osd out 0
ceph osd crush remove osd.0
ceph auth del osd.0
ceph osd rm 0

ceph osd out 1
ceph osd crush remove osd.1
ceph auth del osd.1
ceph osd rm 1

ceph osd out 2
ceph osd crush remove osd.2
ceph auth del osd.2
ceph osd rm 2

# query the status
ceph pg stat
ceph osd status
ceph osd df tree
ceph osd tree

kubectl scale deployment rook-ceph-operator -n rook-ceph --replicas=1
kubectl -n rook-ceph logs -f deployment/rook-ceph-operator
Verify that there are no blocked OSDs
1
ceph osd blocklist ls
remove all blocklist entries
1
2
3
4
ceph osd blocklist clear
ceph osd unset noout
ceph osd unset norebalance
ceph osd unset nodown
wipe the ceph pool
1
2
ceph osd pool delete replicapool replicapool --yes-i-really-really-mean-it
ceph osd pool delete .mgr .mgr --yes-i-really-really-mean-it
and recreate one if needed
1
2
3
ceph osd pool create replicapool 32
ceph osd in 3 4 5 6 7 8
ceph osd tree
At this point the new pool is complaining because we did not enable any application.
1
POOL_APP_NOT_ENABLED: 1 pool(s) do not have an application enabled
You have the possibility to enable file storage (cephFS), block storage or object storage. Here are the commands that enables block storage:
1
2
3
ceph osd pool application enable replicapool rbd
ceph osd pool ls
rbd ls -p replicapool
Later i can create a pool for cephfs or s3 if needed
1
2
ceph osd pool application enable replicapool cephfs
ceph osd pool application enable replicapool rbd
Access the dashboard
Create a service for the dashboard so that we can access it via name resolution instead of the pod’s IP which is not persistent
1
2
3
4
5
6
7
8
9
10
11
12
13
14
15
16
cat <<EOF > ceph-dashboard-svc.yaml
apiVersion: v1
kind: Service
metadata:
  name: ceph-dashboard
  namespace: rook-ceph
spec:
  type: ClusterIP
  selector:
    app: rook-ceph-mgr
  ports:
    - name: https-dashboard
      port: 8443
      targetPort: 8443
EOF
kubectl apply -f ceph-dashboard-svc.yaml
You can either create a local port forwarding tunnel with ssh or use the kubectl command to access it over localhost
1
2
kubectl -n rook-ceph get secret rook-ceph-dashboard-password -o jsonpath="{['data']['password']}" | base64 --decode && echo
kubectl -n rook-ceph port-forward svc/rook-ceph-mgr-dashboard 8443:8443
You’ll have to change the binding options on the dashboard because in my case it was binding on all ipv6 addresses, not the ipv4 ones.
1
2
3
4
5
6
7
8
9
10
11
12
kubectl -n rook-ceph exec -it deploy/rook-ceph-tools -- bash

ceph config get mgr mgr/dashboard/server_port
ceph config get mgr mgr/dashboard/server_addr

ceph config set mgr mgr/dashboard/server_addr 0.0.0.0
ceph mgr module disable dashboard
ceph mgr module enable dashboard

# verify
ceph config get mgr mgr/dashboard/server_port
ceph config get mgr mgr/dashboard/server_addr
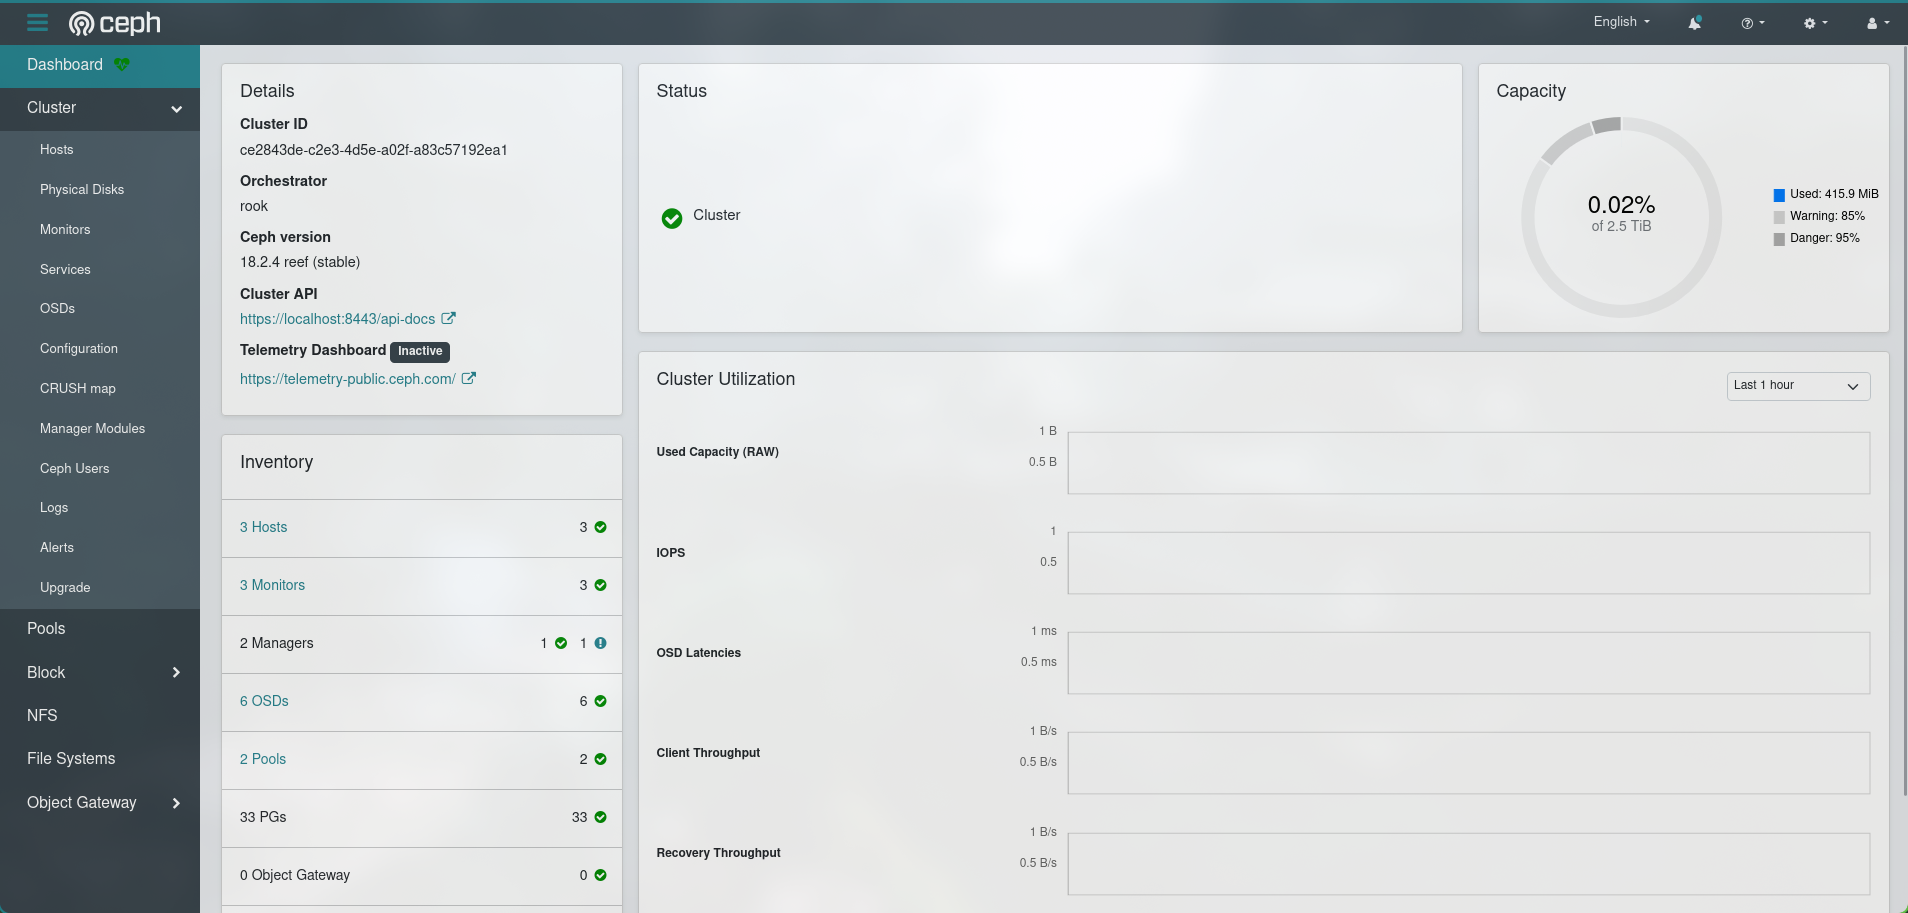
And with that we are done. You can have a look at the ceph cluster’s health through this dashboard
Querying the ceph cluster on the node
It’s not recommended to apply changes through systemd as the ceph cluster is managed by rook-ceph. If you apply any changes they would get overwritten by the kubernetes high availability services. However, you can still copy over two files that will allow you to query the health of the cluster through ceph-volumes.
1
2
3
4
5
6
7
8
9
10
11
dnf install -y ceph-volume

kubectl -n rook-ceph cp \
$(kubectl -n rook-ceph get pod -l app=rook-ceph-tools \
-o jsonpath='{.items[0].metadata.name}'):/etc/ceph/ceph.conf ./ceph.conf

kubectl -n rook-ceph cp \
$(kubectl -n rook-ceph get pod -l app=rook-ceph-tools \
-o jsonpath='{.items[0].metadata.name}'):/etc/ceph/keyring ./keyring

ceph -c ./ceph.conf -k ./keyring status
Or you can make it easier on yourself and simply
1
2
3
4
5
6
7
8
9
10
11
12
13
14
15
16
17
18
19
20
kubectl -n rook-ceph cp \
$(kubectl -n rook-ceph get pod -l app=rook-ceph-tools \
-o jsonpath='{.items[0].metadata.name}'):/etc/ceph/ceph.conf \
/etc/ceph/ceph.conf

kubectl -n rook-ceph cp \
$(kubectl -n rook-ceph get pod -l app=rook-ceph-tools \
-o jsonpath='{.items[0].metadata.name}'):/etc/ceph/keyring \
/etc/ceph/keyring

ceph status
ceph health detail
ceph df

# debugging
ceph osd tree
ceph mon dump
rados df
ceph config dump
ceph versions
Monitoring
We setup the storage cluster earlier but forgot to enable monitoring. Let’s add it now.
Grafana is installed by simply running these helm commands:
1
2
3
4
5
6
7
8
9
10
11
12
13
14
15
16
17
18
19
20
21
22
23
24
25
26
27
28
29
30
31
32
33
34
35
36
37
38
39
40
41
42
43
44
45
46
47
48
49
50
51
52
53
54
55
56
57
58
59
60
61
62
63
64
helm repo add grafana https://grafana.github.io/helm-charts

kubectl create namespace monitoring

kubectl -n monitoring create secret generic grafana-admin-secret \
  --from-literal=password=<secret> \
  --from-literal=GF_AUTH_GENERIC_OAUTH_CLIENT_ID=<secret> \
  --from-literal=GF_AUTH_GENERIC_OAUTH_CLIENT_SECRET=<secret>


cat <<EOF > values.yml
envValueFrom:
  GF_AUTH_GENERIC_OAUTH_CLIENT_ID:
    secretKeyRef:
      name: grafana-admin-secret
      key: GF_AUTH_GENERIC_OAUTH_CLIENT_ID

  GF_AUTH_GENERIC_OAUTH_CLIENT_SECRET:
    secretKeyRef:
      name: grafana-admin-secret
      key: GF_AUTH_GENERIC_OAUTH_CLIENT_SECRET

  GF_SECURITY_ADMIN_PASSWORD:
    secretKeyRef:
      name: grafana-admin-secret
      key: password

grafana.ini:
  server:
    domain: dashboard.thekor.eu
    root_url: https://dashboard.thekor.eu
  auth.generic_oauth:
    enabled: true
    name: Authentik
    allow_sign_up: true
    scopes: openid profile email
    auth_url: https://auth.thekor.eu/application/o/authorize/
    token_url: https://auth.thekor.eu/application/o/token/
    api_url: https://auth.thekor.eu/application/o/userinfo/

ingress:
  enabled: true
  hosts:
    - dashboard.thekor.eu
  ingressClassName: haproxy
  tls:
    - hosts:
        - dashboard.thekor.eu
      secretName: wildcard-cloud2-tls

persistence:
  enabled: true
  size: 15Gi
  storageClassName: rook-ceph-block

service:
  type: ClusterIP
  port: 80
  targetPort: 3000
EOF

helm install grafana grafana/grafana \
  -n monitoring \
  -f values.yml
Debug the environment variables and port forward with ssh
1
2
helm show values grafana/grafana | grep -A5 env
kubectl -n monitoring port-forward svc/grafana 8080:80
Installing prometheus is just as easy. We will configure it to scrape the ceph cluster and display it on grafana.
1
2
3
4
5
6
7
8
9
10
11
12
13
14
15
16
17
18
19
20
21
22
23
24
25
26
27
28
29
30
31
32
33
34
35
36
37
38
39
40
41
42
43
44
45
46
47
48
49
50
51
52
53
54
55
56
57
58
helm repo add prometheus-community https://prometheus-community.github.io/helm-charts
helm repo update
helm install prometheus prometheus-community/kube-prometheus-stack -n monitoring

kubectl apply -f https://raw.githubusercontent.com/prometheus-operator/prometheus-operator/main/example/prometheus-operator-crd/monitoring.coreos.com_servicemonitors.yaml
kubectl apply -f https://raw.githubusercontent.com/prometheus-operator/prometheus-operator/main/example/prometheus-operator-crd/monitoring.coreos.com_podmonitors.yaml
kubectl apply -f https://raw.githubusercontent.com/prometheus-operator/prometheus-operator/main/example/prometheus-operator-crd/monitoring.coreos.com_prometheuses.yaml
kubectl apply -f https://raw.githubusercontent.com/prometheus-operator/prometheus-operator/main/example/prometheus-operator-crd/monitoring.coreos.com_prometheusrules.yaml

kubectl get pods -n monitoring
kubectl get svc -n monitoring

cat <<EOF > rook-ceph-mgr-servicemonitor.yaml
apiVersion: monitoring.coreos.com/v1
kind: ServiceMonitor
metadata:
  name: rook-ceph-mgr
  namespace: rook-ceph
  labels:
    release: prometheus
spec:
  selector:
    matchLabels:
      app: rook-ceph-mgr
  namespaceSelector:
    matchNames:
      - rook-ceph
  endpoints:
    - port: http-metrics
      path: /metrics
      interval: 30s
      scheme: http
EOF

cat <<EOF > rook-ceph-exporter-servicemonitor.yaml
apiVersion: monitoring.coreos.com/v1
kind: ServiceMonitor
metadata:
  name: rook-ceph-exporter
  namespace: rook-ceph
  labels:
    release: prometheus
spec:
  selector:
    matchLabels:
      app: rook-ceph-exporter
  namespaceSelector:
    matchNames:
      - rook-ceph
  endpoints:
    - port: ceph-exporter-http-metrics
      path: /metrics
      interval: 30s
      scrapeTimeout: 10s
EOF

kubectl apply -f rook-ceph-exporter-servicemonitor.yaml -f rook-ceph-mgr-servicemonitor.yaml
kubectl get servicemonitor -A | grep rook-ceph
Verify that prometheus is scraping both ceph jobs:
1
kubectl -n monitoring port-forward svc/prometheus-kube-prometheus-prometheus 9090:9090
And type this in the search bar: up{job=”rook-ceph-exporter”} or up{job=”rook-ceph-mgr”}
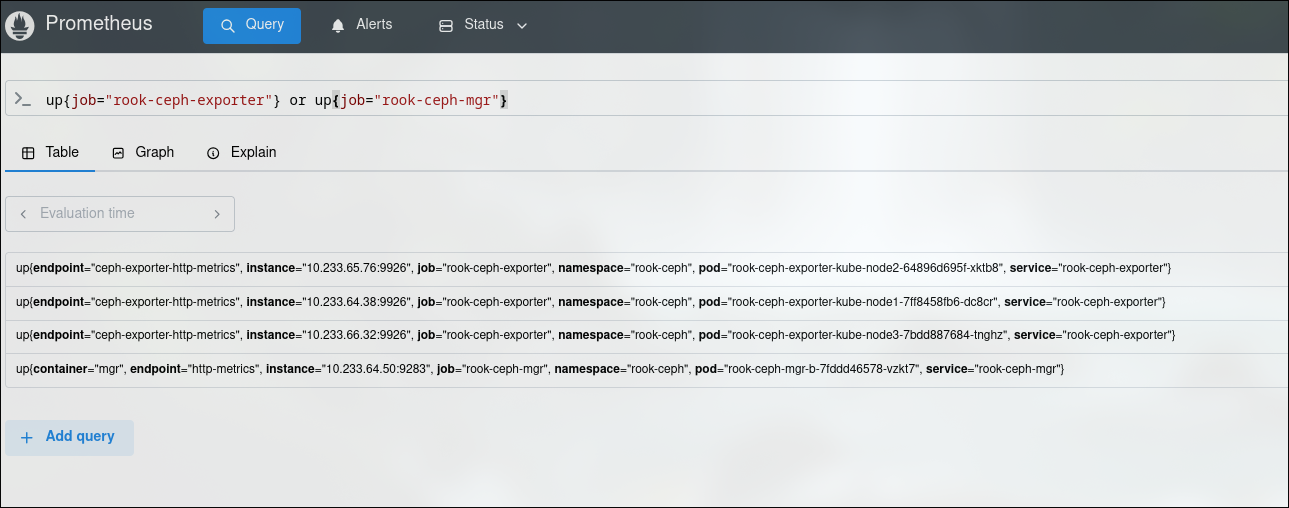
If you did everything correctly these entries should appear in the results